Background
Working with the Department of Energy's (DOE) National Energy Technology Laboratory, Southwest Research Institute® (SwRI®) developed a system to identify methane leaks reliably, accurately, and autonomously in real-time, for the purpose of mitigating methane emissions using Optical Gas Imaging (OGI) cameras. SwRI's Smart Leak Detection – Methane (SLED/M) adds a high degree of automation to the process of methane leak detection to minimize sources of human error, minimize response time to a leak event, and maximize midstream visibility. This research worked towards integrating Quantitative OGI capabilities into this existing technology. The goals for this research were to develop two types of models with the following goals:
- Run in real-time on the edge (≥ 12 Hz)
- Classification: Achieve less than 5% false positive detection
- Classification: Achieve ≥ 95% methane plume detection rate
- Regression: Achieve ≤ 10 standard cubic feet / hour (scfh) prediction > 70% of the time
Approach
In order to achieve these results, multiple infrared (IR) and other sensors were investigated in tandem with the Midwave IR OGI and atmospheric conditions including humidity, temperature, pressure, and solar radiation, provided by a weather station to provide additional information to train the underlying deep learning models. Several machine learning and deep learning architectures and methods, including looking at quantized classification networks and regressions networks, were explored. As data was collected, curated, and labeled, it allowed for more refined regressive networks to be adequately trained, leading to better insight into the true release rates.
Accomplishments
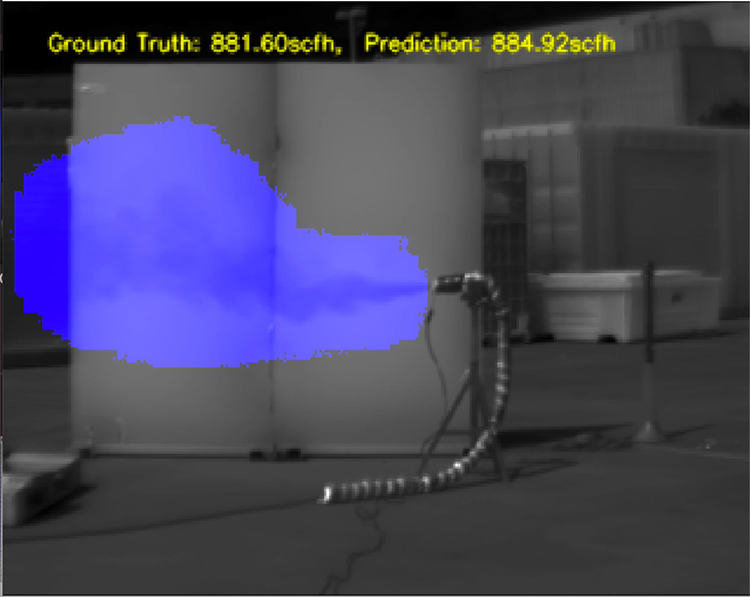
The developed network has a predicted mean average percentage error (MAPE) of 12.3% just outside our target goal of 10%, but an accuracy of 97.78% at ±50 scfh, well within the overall goal for the DOE program. Upon closer inspection, it was observed that more than 10% of datapoints contributing to the MAPE predictions were the result of low flow rate predictions and are beyond the sensitivity of instrument measurement as a result of normal operational variation and noise. The figure shows an example of both SLED-M detection network and subsequent concentration, with ground truth and predicted values in the upper portion of each frame.

Figure 1: SwRI's Smart Leak Detection and Quantification Algorithm
