Background
Magnetostrictive Sensing (MsS) technology allows inspection of tens to hundreds of feet along a pipe from one sensor position. MsS has been successfully developed and marketed by SwRI for more than 30 years. During that time, the Institute has received several patents, conducted multiple government, and commercially sponsored R&D projects, and developed several generations of portable instrumentation that are used by our commercial clients to perform inspection services. However, there is one key weakness in our ability to continue to control and expand our commercial activities in this area: SwRI does not currently have commercial quality SwRI-owned data analysis and acquisition software that can be provided with our instrumentation, and our present supplier of software is discontinuing support for the software that has been provided up until now.
Approach
Acquisition and analysis software will be developed primarily using a high-level commercial programming environment. Existing libraries previously developed by SwRI will be used to support data acquisition on the SwRI MsS instruments. The algorithms will be verified on existing pipe mockups, including 4-inch, 8-inch, and 12-inch diameter pipes with known anomalies. A laboratory software package will be built which will be refined into a commercial program in a follow-on project.
Accomplishments
The acquisition software has been completed. It includes support for single channel and multiple channel multiplexed sensor acquisition, multi-frequency selection, digital filtering, and short time Fourier transform (STFT) processing among other standard features. Data from test pipe samples have been successfully acquired using several different sensors. Figure 1 shows a screen shot of data acquired from one of the sample pipes.
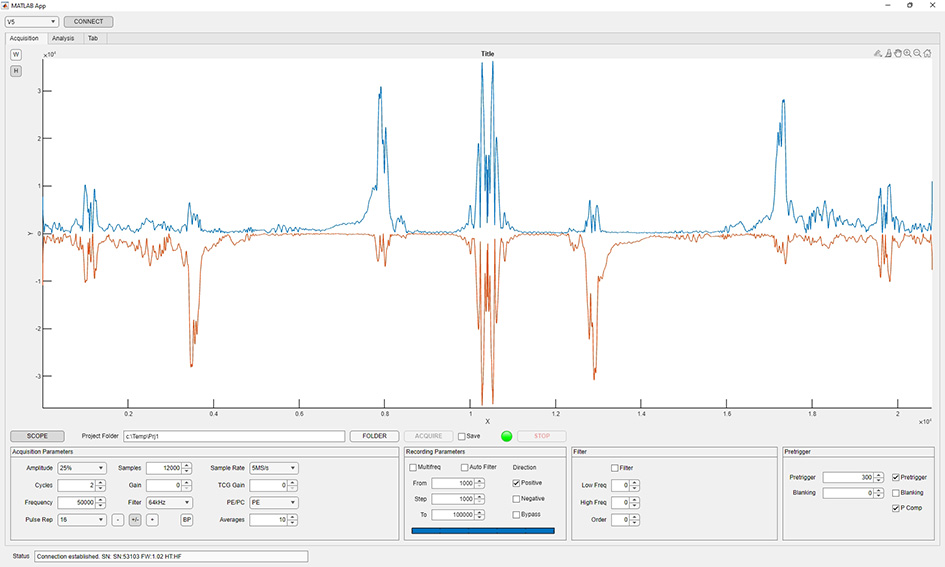
Figure 1: Example of dual direction acquisition from a pipe.
Several advanced processing methods have been implemented in the analysis program. A comparison of three of these algorithms produces an excellent illustration of the current progress. Data was collected on a mock-up of an aluminum tank bottom and vertical wall with an 8x8 element multiplexed sensor. The Common Source Method (CSM), Synthetic Aperture Focusing Technique (SAFT), and Total Focusing Method (TFM) were applied to this dataset to produce the figure below.
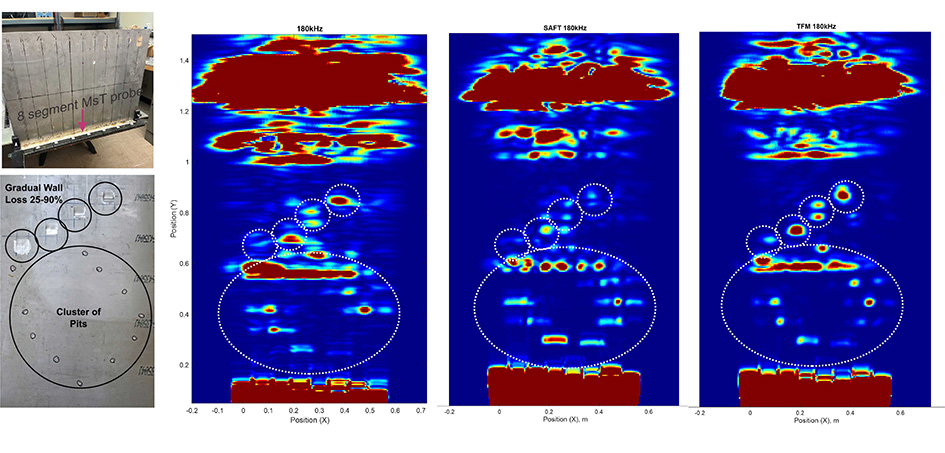
Figure 2: Comparison of three processing methods to a tank mock-up.
Many analysis features are based on the waveforms which are the basic units of acquired data. Figure 3 is a waveform view within the analysis program. Calibration of distance and gain/attenuation are accomplished at this stage. Other features that have been implemented or are under development are automatic location of probable indications, automatic highlighting of double and triple reflections from one indication, analysis of indications using STFTs, and report generation.
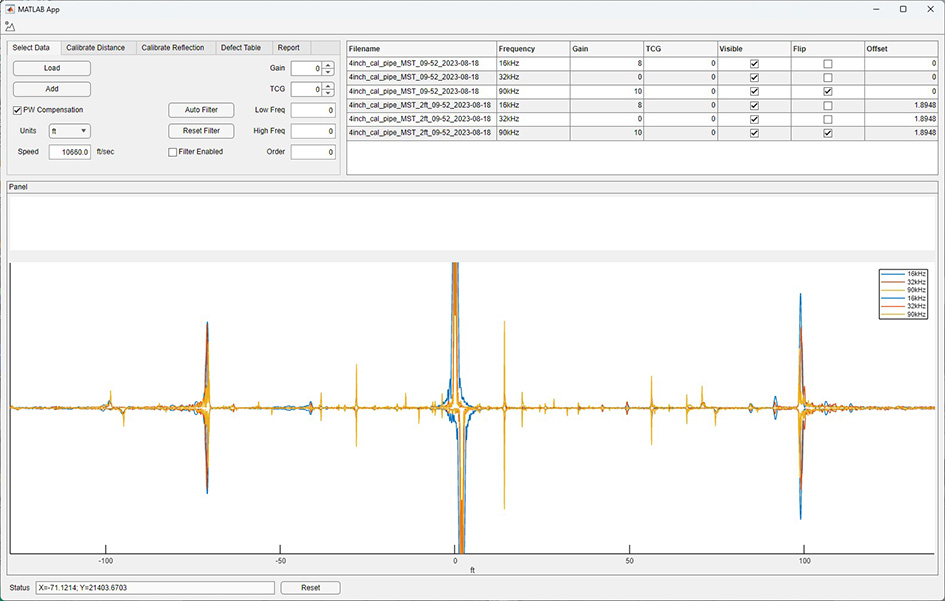
Figure 3: Waveform view within the analysis program.