Background
Low viscosity lubricants help improve vehicle efficiency and reduce CO2 emissions. As a result, hardware manufacturers are adopting lower and lower viscosity lubricants. Ensuring hardware durability at these low viscosities, however, becomes more challenging. One way to enhance both efficiency and durability is by optimizing a lubricant’s rheological properties. Past research suggests that increasing a lubricant’s viscoelasticity can reduce friction and improve durability via increased oil film thickness. Unfortunately, the mechanism responsible for this behavior is not fully understood and no commercial computer models are available to accurately predict engine tribocouple behavior as a function of lubricant viscoelasticity. The purpose of this project is to generate and combine testing data with a computational model capable of predicting friction and oil film thickness in a journal bearing based on lubricant viscoelasticity.
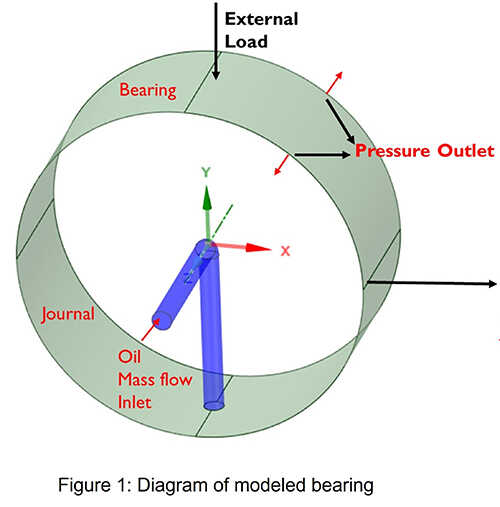
Figure 1: Diagram of Modeled Bearing.
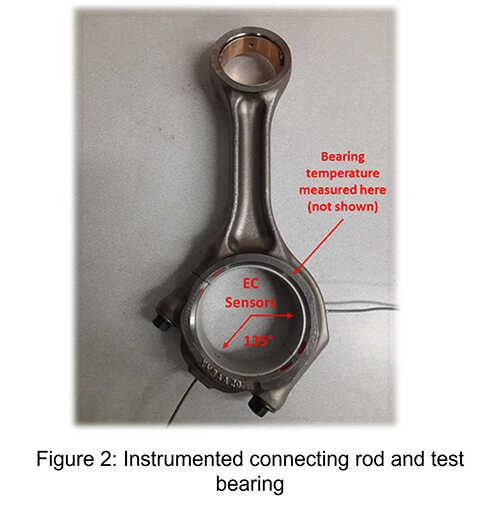
Figure 2: Instrumented Connecting Rod and Test Bearing.
Approach
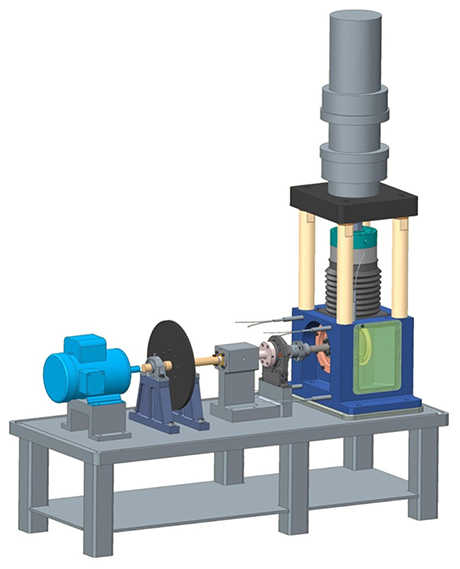
Figure 3: Bearing Test Rig Diagram.
This project used a parallel approach in which the development of a computer model and mechanical testing were conducted simultaneously. Modeling was conducted in ANSYS Fluent while testing was conducted using SwRI’s bearing test rig. In both modeling and testing, the same hardware was used (Cummins ISB).
Accomplishments
Four test oils were prepared for this work, one Newtonian baseline and three non-Newtonian oils with three different levels of viscoelasticity. Different levels of viscoelasticity were achieved by blending oils with different viscosity modifiers. Great care was taken to ensure that oil viscosity was equivalent for all oils. Therefore, any differences observed between oils in testing would be the result of viscoelasticity alone. Testing indicated significantly lower friction torque for all viscoelastic oils compared to the Newtonian baseline. Further, under high shear conditions, the friction torque reduction ranked in order of oil viscoelasticity. In other words, the oil with the highest viscoelasticity resulted in the largest reduction in friction torque. Finally, oil film thickness was also observed to increase with increasing viscoelasticity. Among the viscoelastic oils, and in nearly all test conditions, the high viscoelastic oil produced the largest oil film thicknesses, followed by the mid viscoelastic oil and finally the low viscoelastic oil. Interestingly, the oil film thickness produced by the Newtonian baseline was between the high viscoelastic oil and the mid viscoelastic oil. This behavior was likely the result of the combination of non-Newtonian shear thinning (which occurs in all multi-grade oils) and effective viscoelastic thickening. Therefore, results indicate that it is necessary to have a significant amount of viscoelasticity before effective viscoelastic shear thickening dominates the response of the tribocouple. At moderate and low levels of viscoelasticity, the non-Newtonian shear thinning behavior outweighs the effective viscoelastic shear thickening, resulting in a lower oil film thickness compared to a Newtonian baseline. Modeling results correctly predicted trends among the viscoelastic oils but under-predicted oil film thickness from the monograde baseline. A full set of results were published in SAE 2023-01-1648.
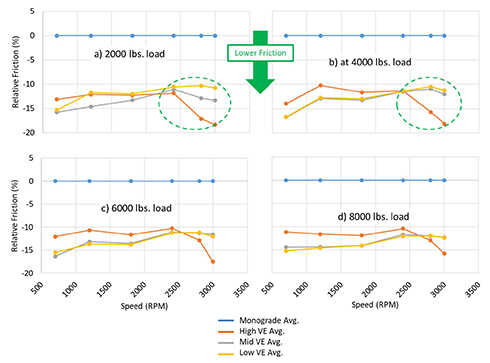
Figure 4: Relative Friction, All Oils; a) 2000 lbs., b) 4000 lbs., c) 6000 lbs., d) 8000 lbs.
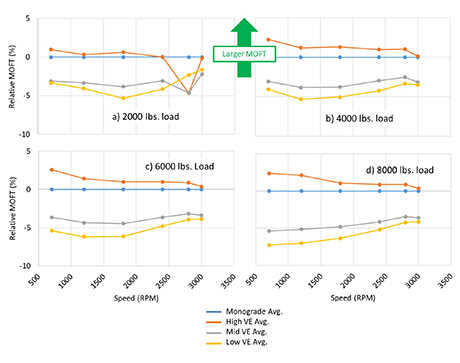
Figure 5: Relative MOFT, All Oils; a) 2000 lbs., b) 4000 lbs., c) 6000 lbs., d) 8000 lbs.
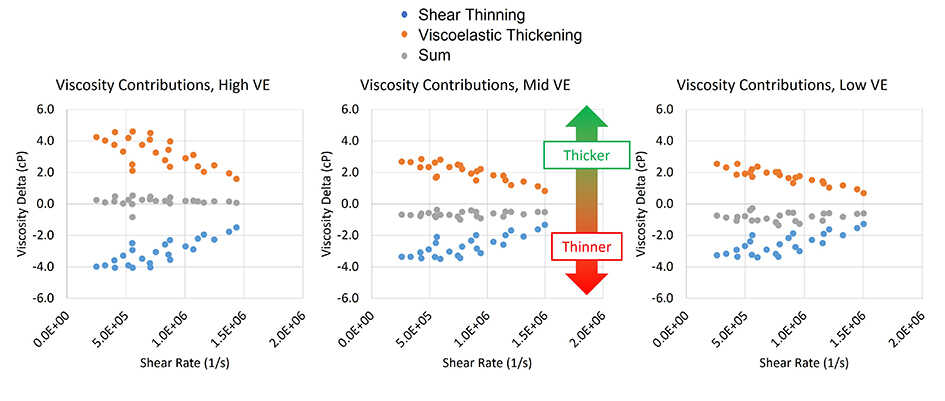
Figure 6: Relative Contributions from Non-Newtonian Shear Thinning and Viscoelastic Thickening.
