Background
The field of data analytics, coupled with the visualization of large datasets, offers the potential to unearth valuable insights that often remain hidden through mere data review. This growing business area encompasses multiple business sectors and domains, including transportation, environment, and space sciences. However, existing tools frequently present limitations, such as a limited ability to focus on relevant insights, high licensing costs, and performance issues when dealing with extensive datasets. This research seeks to create a set of tools capable of creating custom visualizations and uncovering correlations between datasets.
Approach
The objective of this research was to create an extensible, cross-platform data analysis and visualization application capable of displaying geolocated data to facilitate data analysis and comparison between disparate geolocated data sources. Initial visualizations were focused on the transportation domain where we had access to rich datasets and information on user needs for visualizations. Subsequently, we plan to apply this toolset to other domains (e.g., environmental and space sciences) to ensure the toolset combines versatility without domain-specific dependencies.
Accomplishments
Connected vehicle data from roadside equipment and safety messages collected from vehicles were used to create the initial visualization. The application allowed for mapping each set of data, linking safety messages to the roadside units, and then filtering by location, speed, and other data fields present. Additionally, route and travel time data were combined to create a second visualization focused on comparison of travel times for alternate routes over a specific time or day or one route across multiple time and date ranges.
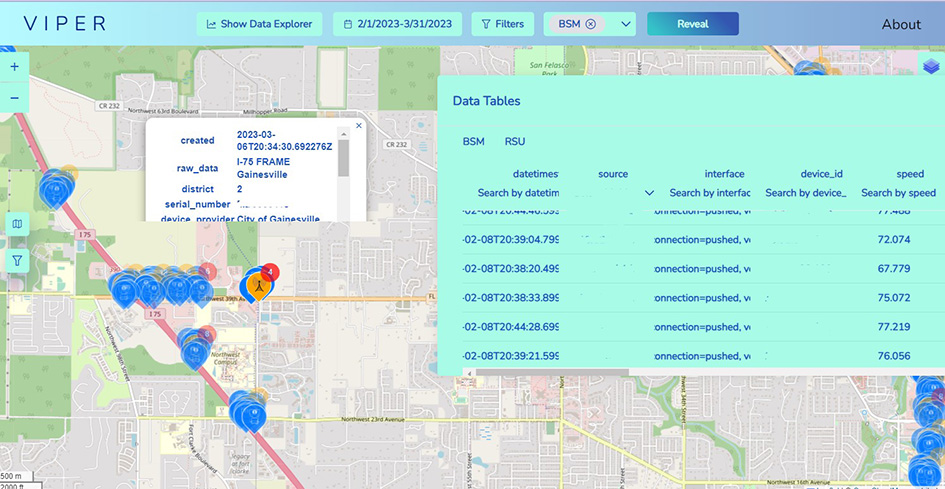
Figure 1: Connected Vehicle Visualization.