Background
Drylands will be disproportionally impacted in future climates, with severe implications for ecological processes, water and food security. These natural habitats range from grasslands to forests, and despite their socioeconomical importance, little is known about their complex water dynamics and response to deviations from the average hydrologic conditions. Drylands’ vulnerability to climatic variability, combined with the increasing frequency of extreme hydrologic conditions, emphasizes the need to understand dryland ecosystem behavior and quantify their ecological disturbances during extreme hydrologic events, such as droughts or floods. Assessing the hydrologic vulnerability of drylands in the context of climate change will provide information that is the backbone of the long-term sustainable management of water resources in arid or semi-arid regions. This project employed a rich array of satellite-based Earth observations to (1) assess the spatiotemporal water dynamics in the drylands and other ecosystems of Texas under drought conditions, and (2) develop a climate change indicator based on an emerging eco-hydrological property - the hydrologic asynchrony or time lag.
Approach
Data sets used in this project included: (a) hydrologic and vegetation-related observations derived from several NASA satellite missions, (b) the Naval Research Laboratory’s WindSat, (c) the SwRI/University of Michigan Cyclone Global Navigation Satellite System (CYGNSS), and (d) data derived from a model-data fusion framework, named VIC4L-GRACE, that the Project P.I. has developed. Project tasks were (1) investigate the hydrologic properties of dryland ecosystems, (2) identify dry spells, (3) quantify eco-hydrological vulnerability, as a function of resilience and sensitivity, (4) quantify the hydrologic asynchrony (time lag) among the major hydrologic components, and (5) evaluate the performance of the proposed climate change indicator across the full hydrologic gradient of Texas.
Accomplishments
Linkages and interactions among various components of the water cycle were assessed, to identify the unique hydrologic properties associated with each climatic regime, revealing a very complex hydroclimatic profile with several regional microclimatologies. The behavior of different ecosystems and response to drought conditions were also quantified, identifying groundwater-dependent ecosystems, unique vegetation-atmosphere-soil dynamics, and regions characterized by a synergistic relationship, with reciprocal effects, between the vegetation and the soil type(s) that support(s) it. The hydrologic asynchrony index performed significantly better over the arid or semi-arid regions, indicating the potential of extrapolating this method worldwide to produce a global satellite product that can be used to better characterize dryland ecosystem health and hydrologic vulnerability.
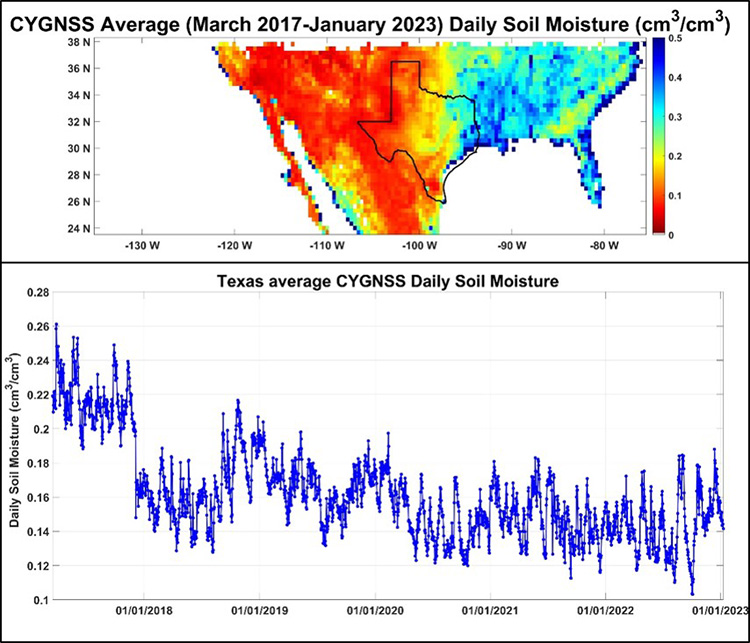
Figure 1: Temporally-averaged map of daily soil moisture data derived from CYGNSS (top) and daily time series of spatially-averaged CYGNSS soil moisture (bottom).
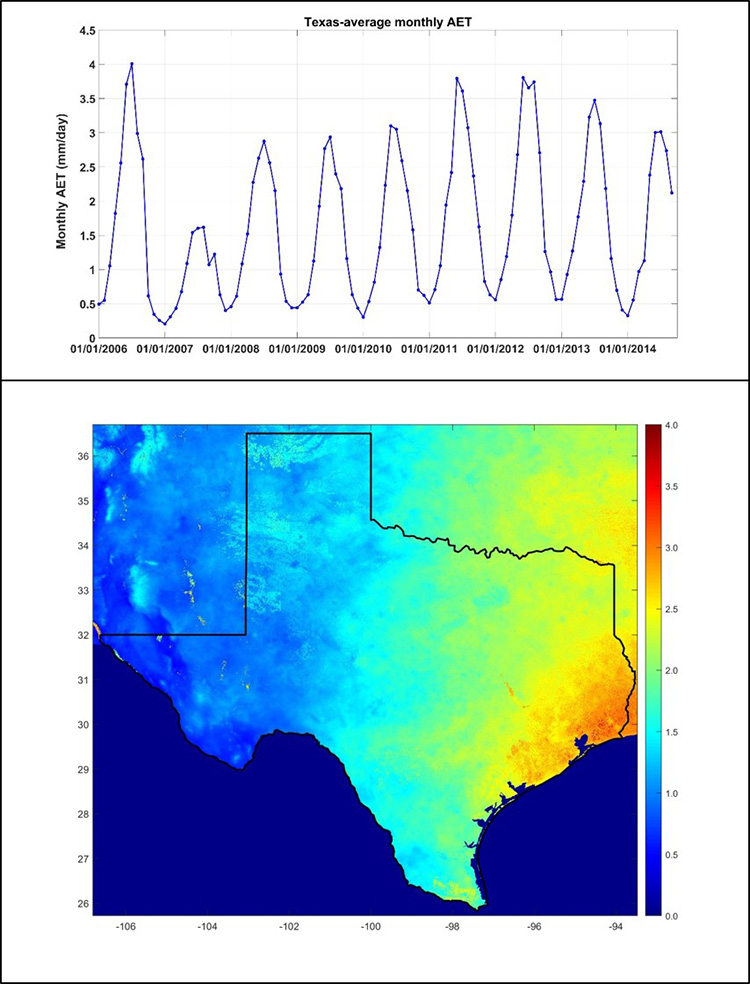
Figure 2: Monthly time series of spatially-averaged actual evapotranspiration (AET) data (top) and temporally-averaged map of daily AET derived from both ECOSTRESS and VIC4L-GRACE (bottom).
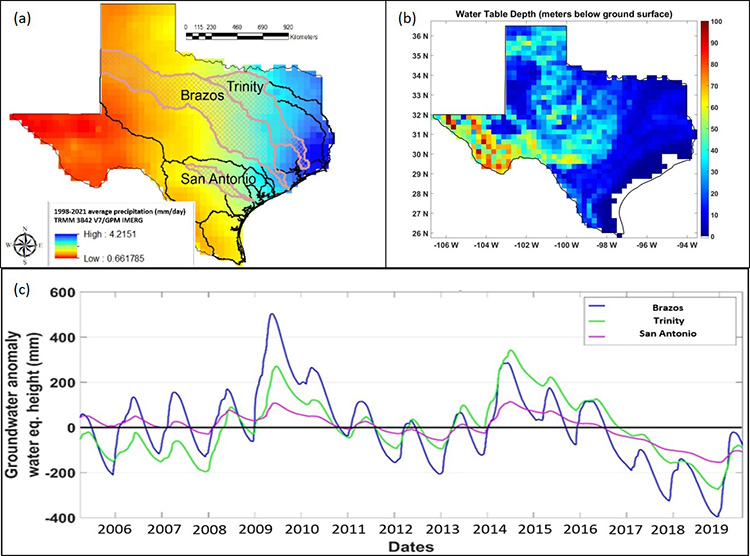
Figure 3: Average (1998-2021) daily precipitation in Texas, overlaid by three major hydrologic basins (a). VIC-4L-generated temporally-averaged water table depth map (b). Spatially-averaged groundwater anomaly (expressed as mm of water equivalent height) daily time series over each of the three hydrologic basins of Texas (c).
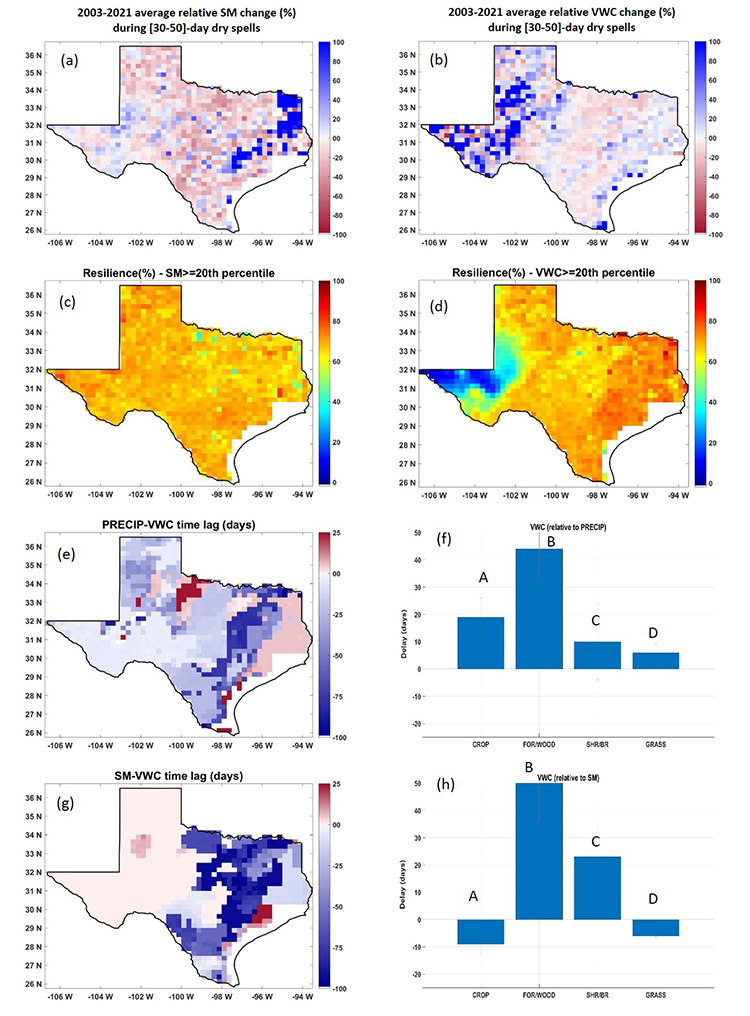
Figure 4: Sensitivity of (a) soil moisture (SM) and (b) vegetation water content (VWC) in Texas during moderate dry spells. Average SM (c) and VWC (d) resilience, calculated as the number of consecutive days, within each dry spell, during which SM/VWC remained above a specific threshold, and normalized by the total dry spell duration. Time lag presented as (e, g) maps and (f, h) space-average values for the four major land-cover categories between precipitation and VWC, and SM and VWC. Error bars represent standard deviation. Columns in bar plots marked by different letters are significantly different as determined by a one-way (Analysis of Variance) ANOVA test followed by a Student-Newman-Keuls multiple comparison test.