Background
As part of a broader research partnership between the City of San Antonio government (CoSA), USAA, and the University of Texas-San Antonio (UTSA), known as the R&D League, SwRI and the CoSA collaborated on an internal research and development (IR&D) program to develop an interactive platform for integrating multidisciplinary datasets that enable subsequent analyses and high-resolution visualization. The objective of this project is to showcase the use of data fusion on the urban heat island (UHI) phenomenon in the City of San Antonio. Prominent factors have been attributed to increased risk of heat vulnerability in the U.S., such as socioeconomic status (poverty intensifies risk), housing type and quality (e.g., mobile homes, HVAC prevalence), age and/or social isolation, and health (e.g., diabetes, cardiovascular disease). However, a common theme in the literature is the significant spatiotemporal variability in results at all scales. In other words, no two states, cities, or even tracts are the same. Consequently, it is critical for cities to perform independent analyses of city-specific and hyperlocal factors (e.g., climate, city ordinances, demographics), and leverage multifaceted datasets to properly characterize UHI impacts and evaluate mitigation measures. To do this, city officials need a way to efficiently integrate and analyze these data and transform the information into actionable knowledge and insight.
Approach
The data visualization tool was created in Python to study the UHI phenomenon in San Antonio. The tool utilizes over 230 different data sets as the backbone of the analyses. The data tool allows for multi-variable analyses to determine a wide range of susceptibility to extreme heat and inform potential mitigation strategies. To demonstrate the capabilities and use of the data fusion tool in informing UHI policy making, the team created a hypothetical case study in which multiple datasets from different data sources would be merged and compared. The case study consisted of a scenario in which city officials are trying to select locations to implement UHI mitigation strategies at public transportation sites (e.g., bus stops) based on local socioeconomic, environmental, and infrastructure characteristics.
Accomplishments
The Heat Island Data Exploration (HIDE) tool and approach developed in this project aim at fusing these critical factors into a user-friendly platform with an emphasis on visualization and rapid identification of areas and/or populations of interest. The HIDE tool also provides a means for city officials and planners to pursue funding solicitations that require the processing and analysis of disparate datasets, as well as promote data sharing and communication among different city departments and outside institutions.
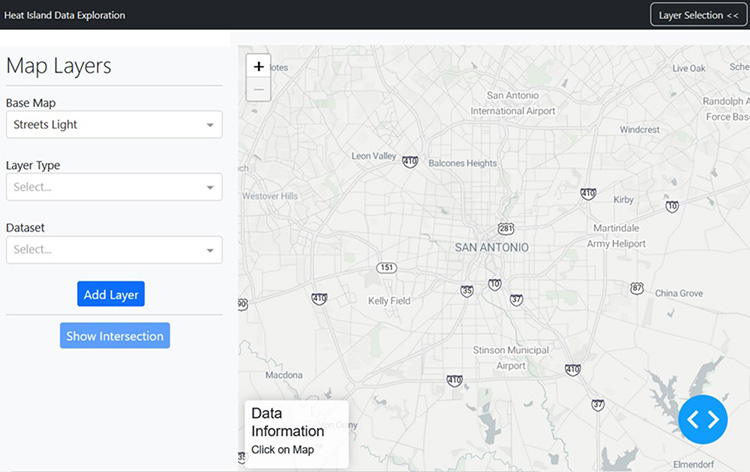
Figure 1: HIDE Tool – The landing page of the exploration tool lets the user change the base map for the visualization and add multiple layers from the gathered data sets.
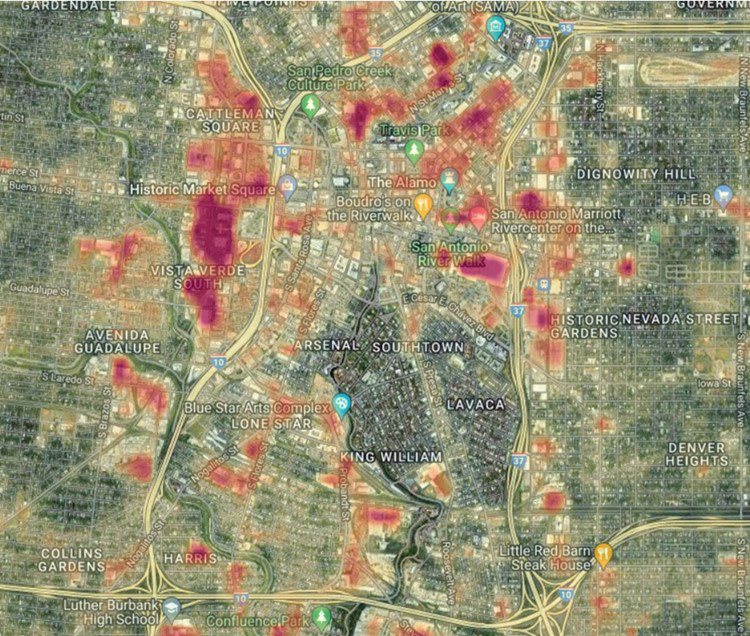
Figure 2: Surface Temperatures – Example of heat map on a particular day.