Tutorial - Getting Started
This video provides a brief introduction to using NESSUS. It is intended to help new users get started setting up and solving problems.
Tutorial - Limit State Concept
The first step when performing a probabilisitc analysis is formulating the problem, and this is sometimes the most difficult part of the process. This tutorial introduces the concept of a limit state, which is fundamental to the formulation of a probabilistic analysis.
Background
Probabilisitc analysis is concerned with assessing the probability that a design will satisfy one or more performance criteria. It is up to the analyst to formulate what constitutes acceptable performance, or conversely failure, for the design under consideration. For example, one may want to determine the probability that the maximum stress developed in a component under loading exceeds the yield stress of the material.
Most formulations of what constitutes failure have two components: a capacity (also referred to as a resistance), commonly denoted R, and a load, denoted S. Failure is then defined as occurring when the load exceeds the capacity: S > R. Note that both the load and the capacity may be random quantities. Further, the load and/or capacity may be expressed as a functional relationship to a set of design parameters, Xi. For example, the maximum stress in a cantilever beam will be a function of the geometry parameters, the modulus of elasticity, and the applied load: these design parameters are referred to as the basic random variables.
The purpose of the limit state concept is to provide a unified framework for expressing probability of failure definitions. The limit state defines the boundary between the safe and unsafe regions of the design space. In terms of the load and capacity, the limit state is given by R = S. However, the limit state is traditionally formulated by grouping all random quantities together, so this limit state is more commonly written as R − S = 0. This is an important concept, and the reason this is done is so that all the information about the performance of the system needed to determine whether or not it is safe or unsafe is captured by one quantity. This quantity is referred to as the performance function and is commonly denoted by Z. Note that traditionally, the unsafe region is the region in which the performance function is less than a critical value (in this case less than 0). This is the convention used by NESSUS. Most generally, the performance function may be expressed in terms of all of the basic random variables in the problem: Z = g(X1,X2,...,Xn).
Examples

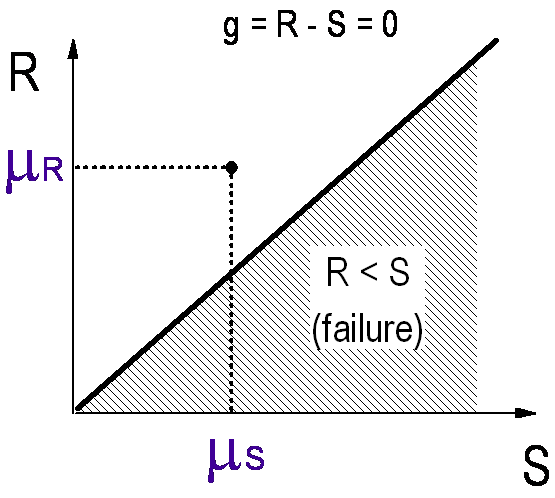
Mean values of the random variables located in the safe region
One of the simplest limit states exists when the basic random variables themselves are the capacity and load of the design. In this case the limit state is given by Z = g(R,S) = R − S = 0. Note that the limit state is formulated such that the unsafe region corresponds to Z < 0. This limit state is depicted in the figure below, with the failure region shaded. Note that the mean values of the random variables are located in the safe region.
R − S is not the only possible limit state formulation for this problem. Another formulation sometimes seen is Z = g(R,S) = R/S = 1. Note that this limit state formulation still expresses the boundary between the safe and unsafe regions. When Z > 1, the design is safe, and when Z > 1, the design is unsafe.
For more complicated problems, often the load is not a basic random variable, but it is a function of other basic variables. For example, consider a cantilever beam, where the failure condition is defined in terms of maximum stress. In this case, the basic random variables may include geometry parameters, modulus of elasticity, and applied force. This is simply an extension of the basic R − S formulation. We simply start with Z = R − S = 0 and replace the load S with a functional relationship, say g1, among the basic variables:
Z = R − g1(X1,X2,X3) = 0.
Summary
The limit state concept allows any failure definition to be expressed in a unified manner:
- Analyst must define what constitutes a safe or unsafe design, based on some measure of system performance
- Limit state expresses boundary between safe and unsafe region of design space
- Performance function is expressed in terms of all random quantities (basic variables)
- By convention, failure occurs when performance function is less than a critical value (which is often 0)
- Basic limit state formulated in terms of capacity and load: Z = R − S = 0
- Capacity and/or load may be functions of other basic variables
