We live in a chemical world. The water we drink (H20), the oxygen we breathe (O2), the sugar on the table (C12H22O11) and everything we touch, taste and use are made up of an array of chemicals. Traditionally, when a chemist analyzes medicine, cosmetics or environmental samples, the question asked is how much X, Y or Z is in the sample.
DETAIL
Exposomics is the study of the exposome, the measure of exposures an individual has over a lifetime and the subsequent effects on their health. Exposomics seeks to understand how exposures from our environment, diet, lifestyle, etc. interact with our unique characteristics — such as genetics and physiology — and affect our well-being.
Recent advances in analytical technology have raised a different and more fundamental question: What is everything in this sample? The answer is frequently an astonishing array of chemicals, often hundreds or even thousands of different chemicals in a single sample. All these compounds — some known, some unidentified, some benign and some harmful — are part of the chemical world we live in.
Trying to understand the chemical cocktail we are exposed to has led to the emerging field of exposomics, which is the science of understanding why one person gets ill from a chemical exposure while another does not. Heredity plays a part, but it is not the complete story. The largest difference is associated with the variation of exposures to the array of chemicals that we just now are starting to recognize in our world.

About the Authors
Principal Scientist Dr. Kristin Favela leads efforts to comprehensively identify the chemical composition of complex samples in SwRI’s Chemistry and Chemical Engineering Division. She is an expert in mass spectrometry who has developed and validated numerous methods now routinely used in industry. Institute Scientist Dr. Keith Pickens specializes in mixed software/hardware development in the Space Science and Engineering Division. His diverse interests include Jovian radiation effects, planetary protection, supercomputer modeling techniques to evaluate spaceflight hardware and now software tools for chemical analyses.
Today’s modern analytical instruments have opened the door to answering the “what is in this sample” question through a procedure known as non-targeted analysis (NTA). The resulting thousands of possible chemicals in each sample represents a daunting challenge to chemists because even the most precise analytical equipment is not perfect. Each potential chemical signal requires a chemist to check whether it is a real indication of a detected chemical or a spurious data artifact. Data artifacts can occur as a result of preparative or investigative procedures and are invalid datapoints. Combing through the data to identify these signal artifacts is a difficult, time-consuming and expensive process that limits the resources available to characterize the unknowns and the assessment of suspect matches in a sample.
DETAIL
Artificial intelligence (AI) mimics human cognitive processes on computer systems, allowing a machine to become increasingly capable of solving a problem.
To shine a light on this hidden chemical world, Southwest Research Institute has assembled the Artificial Intelligence for Mass Spectrometry (AIMS) team. AIMS includes chemists, data analysts and computer scientists with expertise in machine learning and mass spectrometry. SwRI has experience developing autonomous solutions for many industries, including automated vehicles, robotics, space science and environmental chemistry. Drawing upon decades of experience, SwRI has developed Floodlight™, a novel software tool that efficiently discovers the vast numbers of chemical components — previously known and unknown — present in the food, air, drugs and products we are exposed to every day. This cheminformatics machine learning tool integrates algorithms with analytical chemistry software to provide deep analysis of data from gas chromatography mass spectrometry (GC/MS) and other instruments.
Chemical Spectra
Mass spectrometry measures the mass of different molecules within a sample. Because everything from individual elements to large biomolecules such as proteins is identifiable by mass, scientists can use mass spectrometry to identify molecules and detect impurities in a sample. The resulting data are shown as a series of graphical peaks and/or colorful spectra that indicate the identity and volume of chemicals present.
Traditionally, targeted analysis (TA) matched identified components against a library of chemicals, providing a list of all chemical matches. Components not associated with library matches were typically ignored. NTA, by contrast, examines every resolved peak without using a pre-defined list of targeted chemicals. NTA methods applied to complex mixtures could identify thousands of unknown compounds that are not yet in databases and have never before been described or studied.
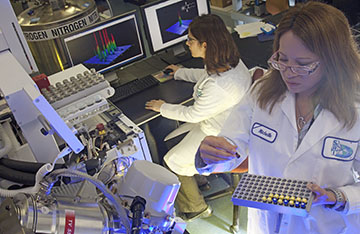
Dr. Kristin Favela (background) led a team of chemists including Michelle Zuniga, developing rapid analytical methods to characterize chemicals in consumer products. SwRI has evaluated thousands of samples including millions of signals, data used as inputs for the Floodlight machine learning tool.
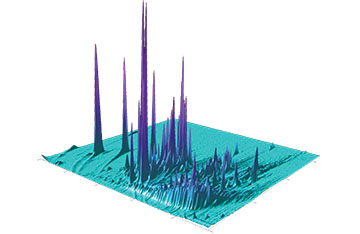
GCxGC sample analysis produces big data sets, containing thousands of signals within a large dynamic range over many dimensions.
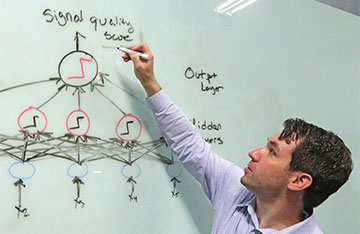
Dr. Andrew Schaub illustrates how an artificial neural network can predict a single output value or signal quality score using a list of inputs from a given set of features analyzed across multiple layers of processors.
High-resolution chromatographic and mass spectrometric systems are the primary tools of NTA. The chromatograph separates components in a mixture so that, ideally, only one compound at a time is processed by the mass spectrometer, which measures the mass of the intact ionized chemicals and/or their fragmented ions. This chemical fingerprint is a powerful identification tool. The state-of-the-art comprehensive gas chromatography time of flight mass spectrometry (GCxGC-TOF MS) instruments use two integrated GC columns that separate components by boiling point and polarity or charge. This combination segregates the different data peaks more distinctly and arranges the images in patterns according to compound structure, useful when studying complex samples.
Using GCxGC-TOF MS, SwRI recently conducted an NTA study to characterize the chemicals in 100 consumer products. Initial analyses detected 4,270 unique chemical signatures across the products; 1,602 could be identified tentatively and 199 could be confirmed using chemical standards. Of those signatures that could be seen in the samples, approximately 80% of the chemicals were not listed on consumer product data sheets.
DETAIL
A matrix refers to overall composition of a sample to be analyzed. Matrices can have considerable effects on analyses and the quality of the results.
This study highlighted not only the ability of NTA to comprehensively investigate the chemical compositions of complex matrices but also how the tremendous amount of data generated limited throughput. GCxGC experiments result in chromatograms, complex data files and peak lists. Chemists must painstakingly analyze the quality of the peaks in the complex data sets because 20% to 50% are artifacts, which creates a major bottleneck in the process. The time needed to remove the low-quality signal artifacts limits the number of full investigations that are feasible. Reducing the manual review time for GCxGC data would allow more samples to be processed using NTA workflows.

Floodlight is a multidisciplinary project to advance our understanding of chemicals in the food, air, drugs and products we are exposed to every day, as shown in these spectrometric datasets.
To address this limitation of gas chromatography-based studies, SwRI’s Floodlight artificial intelligence, machine-learning-driven tool automates the signal quality review of GCxGC-MS data in a high-throughput manner. The “secret sauce” in this neural-network-based solution is the copious amounts of processed NTA data SwRI had available to teach the tool.
Data Deep Dive
SwRI enlisted its computer specialists to evaluate artificial intelligence techniques to automate the review process, specifically using machine learning. The team identified deep learning techniques, also known as neural networks, to develop algorithms that would learn from datasets where chemists had already combed through and identified data artifacts. This allowed the algorithms to learn to do this tedious process autonomously.
DETAIL
An algorithm is a set of steps for a computer program to accomplish a task.
Machine learning algorithms automate the processing and interpretation of large amounts of complex data by extracting and learning patterns from raw data using supervised and unsupervised learning. Supervised learning maps an input to an output based on an example input-output pair. It infers a function from labeled training data, in this case data that have spurious signals labeled, so the computer learns which data signatures are relevant as well as those that are not.
The team used an artificial neural network (ANN) as a predictive model, trained using supervised learning, to classify data. Known inputs are fed into the top layer of an ANN, which passes those values through one or more hidden layers. The supervised learning algorithm analyzes the training data and produces an inferred function, which can be used for mapping new examples. An optimal scenario will allow for the algorithm to correctly determine the class labels for new, unlabeled datasets. This requires the learning algorithm to generalize from the training data in a “reasonable” way. ANNs have a high tolerance for noisy data and excel at classifying patterns.
To use deep learning to identify the irrelevant peaks in the spectroscopic data, an image recognition neural network breaks down and examines different features. The algorithm is optimized through trial and error and computational back propagation through the various layers of the neural network, eventually narrowing down its predictions to something that is accurate. The learning process takes the inputs and the desired outputs and updates its internal state accordingly, so the calculated output is as close as possible to the desired output.
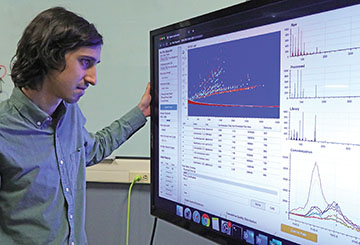
Michael Hartnett demonstrates how users access Floodlight data through a modern, intuitive web-based interface.
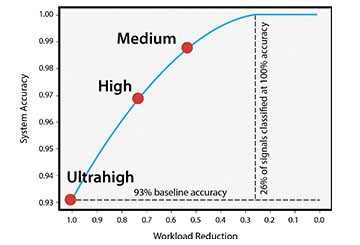
Floodlight’s automated review process offers accuracies equivalent to those of a human expert. Even set for ultrahigh throughput, the tool provided accuracies of 93% or higher while reducing human workloads by 100%.
SwRI’s multidisciplinary Artificial Intelligence for Mass Spectronomy (AIMS) team:
Kristin Favela, Ph.D.; Jake Janssen; Austin Feydt; Keith Pickens, Ph.D.; John Gomez; Andrew Schaub, Ph.D.; Chris Gourley; Heath Spidle; Michael Hartnett; Adam Van Horn; Ken Holladay, Ph.D.; David Vickers, P.E.; Alice Yau
Flipping on Floodlight
To automate the sample chemical profile review process, the AIMS team developed an ANN capable of assessing the signal quality of chemical peaks in the spectroscopic data. The team trained the Floodlight™ algorithm with an initial set of 128,044 curated spectra tagged with chemical metadata.
DETAIL
Metadata is a set of data that gives information about other data.
Chemists manually reviewed and labeled the spectroscopic data peaks from processed GCxGC-TOF samples. Datasets included a significant representation of both poor- and high-quality signals, diverse sample types and a range of ion intensity values within the representative samples. The model evaluated diluted and concentrated samples to assess the ion intensity values within peaks, which can span several orders of magnitude. Tuning the ANN and feature engineering techniques strengthened the model, resulting in improved predictions of signal quality.
Floodlight displays results using an intuitive web interface that can be accessed using most modern web browsers. It is scalable to institution-level with a server-client architecture or can be hosted on a single machine. The peak quality output score provided by the model can be set to determine which peaks are artifacts (low quality), ambiguous (medium quality) or reportable (high quality) because different projects have different demands with regard to the throughput and accuracy desired.
SwRI used threshold benchmarks to assess model performance. For rapid results, an ultrahigh-throughput threshold benchmark classified every evaluated signal as either low quality or high quality while maintaining 93% accuracy and reducing the workload by 100%. This accuracy is comparable to a human expert. A high-throughput threshold resulted in an 80% workload reduction, labeling 20% of peaks as ambiguous. The high-throughput threshold benchmark was 97% accurate at labeling peaks. The medium-throughput threshold benchmark labeled 60% of the peaks with 99% accuracy and left the remaining 40% peaks for manual review. The medium-throughput threshold mimicked requirements typically seen for forensics or other applications requiring a low rate of misclassifications. Floodlight supports manual relabeling of peaks, which provides the machine learning algorithm with continual feedback, improving performance across diverse sample matrices over time. The ANN, with frequent input from the subject matter experts, continues to evolve and improve.
CONCLUSION
Floodlight — an artificial intelligence machine learning-based tool that puts big data to work, screening the prodigious data collected by today’s analytical chemistry instruments — is available for license. It automates GCxGC-TOF sample workflows to support deep analysis of large data sets. Using this high-throughput screening method, analytical chemists spend less time on spectral quality review while maintaining accuracies comparable to human experts. This frees chemists to focus on the most important tasks at hand: characterizing unknown compounds and assessing suspect screening matches in a given sample. Furthermore, Floodlight can potentially be adapted for other analytical chemistry techniques, such as liquid chromatography. The AIMS team is currently developing chemical data correlation and visualization tools, to shine a more powerful light on the chemicals that we interact with in our daily lives.
Questions about non-targeted analysis? Contact Dr. Keith Pickens or call +1 210 522 3910 or contact Dr. Kristin Favela or call +1 210 522 4209.

