Background
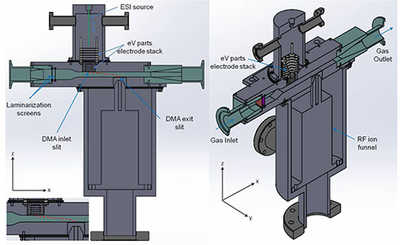
 Figure 1: Two cross-sectional views of the DMA design with a front-on view (left) and isometric view (right).
 The purpose of this project was to simulate, design, fabricate, and test a differential mobility analyzer (DMA) suitable for a Titan lander. Since the discovery of Titan’s atmosphere in 1947, findings from Voyager 1 and 2 and, most recently, Cassini-Huygens have pointed to unique atmospheric chemistry involving nitrogen (N2) and methane (CH4). This unique chemistry leads to tholins, thought to be responsible for the brown/orange haze in the atmosphere. The Ion Neutral Mass Spectrometer of Cassini-Huygens measured C3H8, C4H2, HCN, HC3N, C6H6, and C2N2. The Cassini Plasma Spectrometer sensors, the Ion Beam Spectrometer (IBS), and Electron Spectrometer (ELS) revealed what is suspected to be heavy hydrocarbon and nitrile species with the IBS detecting positive ions up to 350 Daltons (Da) and the ELS measuring negative ions up to 13,800 Da. Interest in tholins has sparked many laboratory simulations on creating and analyzing tholins to explain Titan’s chemistry. Our motivation for building a DMA is that a DMA analyzes ions based on their size-to-charge, or mobility, thereby providing information on molecular and aerosol sizes of tholins in the atmosphere of Titan.

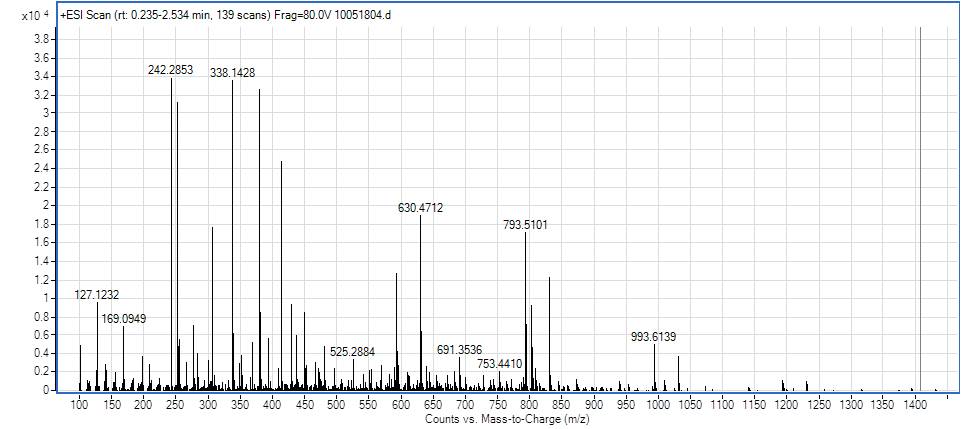
Figure 2: Mass spectrum of the experimental tholin sample dissolved in anhydrous ACN/MeOH.
Approach
The DMA is a parallel plate design (Figure 1). The two parallel plates are called the inlet and outlet plates with the inlet plate containing the inlet slit for ions to enter the DMA and the outlet plate having an outlet slit at a fixed horizontal distance (x-dimension) from the inlet slit. In this design, a voltage difference is applied between the two plates providing an electric field to accelerate ions (z-dimension) between the plates while a perpendicular flow of gas pushes the ions along the horizontal axis of the DMA (z-dimension). The mobility of the ion (ion size) determines its collision frequency with the perpendicular flow of gas and how fast it can move in the z-dimension from the applied electric field. Ions of high mobility, considered of small size and low cross section, are able to move a greater distance between the plates compared to larger sized ions of lower mobility at a fixed electric field. For a fixed perpendicular gas flow rate, the electric field between the two plates can be scanned so ions of all mobility can be collected after the exit slit. A DMA plot would show ion current, or ion signal, on the y-axis versus the DMA voltage on the x-axis. Thus, it is a scanning technique where the DMA voltage scan reveals information on the size of ions passing through the device. Coupling the DMA to a mass spectrometer would provide orthogonal separation methods and yield information of ion size and mass-to-charge. This would aid in understanding the structure and chemistry of Titan tholins.
Accomplishments
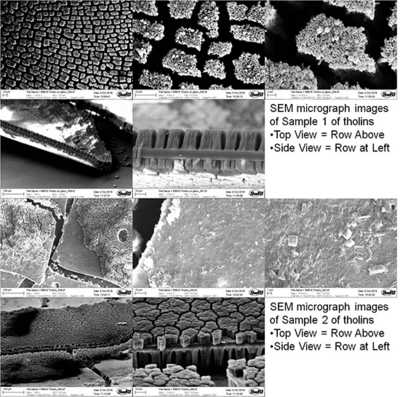
 Figure 3: Electron micrograph images of two tholin samples display very interesting, but also seemingly ordered structure.
 We have successfully simulated, designed, and are currently in the fabrication process for completing the prototype DMA. Initial two-dimensional boundary layer thickness calculations were performed to determine optimal DMA contraction design (Görtler parameter) to provide uniform flow. Computational fluid dynamics software ANSYS Fluent® was also used to simulate the resolution and sensitivity of the DMA design. A design was selected that could analyze particles in the size range of 1–50 µm at a uniform gas flow rate and reasonable Reynolds number. We are currently waiting on a few parts to finish being machined and then we will complete the build of the DMA, as shown in Figure 1. Rigorous experimental testing will then begin on the DMA.
As part of the experimental testing, we plan to analyze tholins in the DMA to demonstrate the proof-of-concept for an instrument suitable for Titan. We have successfully produced tholins as a part of this program as confirmed by mass spectrometry analysis. The mass spectrum in Figure 2 shows highly abundant ion signals at 127, 242, 338, 630, and 793 that were confirmed to be of the chemical formula CxHyNz. We also obtained scanning electron micrograph images of the produced tholins (Figure 3).

