Background
Liquefaction resistance of a specific soil deposit is most effectively studied using laboratory tests. The discrete element method (DEM) provides powerful capabilities to simulate laboratory-scale tests of granular media. Direct simple shear (DSS) tests are increasingly used in characterizing soil behavior under cyclic loading simulating earthquake loading. DEM models are particularly well-suited for simulating dry sand constant volume DSS tests, which are typically used to assess resistive capacity of soil against liquefaction by studying the changes in effective stresses and volume compaction due to earthquake loading. The DEM explicitly models each particle in a granular medium and can be used to approximate the effects of grain size distribution and soil fabric associated with loose sand. Model development using DEM is complex because of the enormity of the number of soil particles, even in a laboratory scale test sample, and the need to simulate the physical process of DSS testing, which involves sample preparation, consolidation, and cyclic loading. A cautious and verifiable approach was used in the model development where DSS simulation was verified by modeling DSS laboratory testing of larger sized glass bead particles and then refined and perfected to accurately simulate DSS tests of real soil samples.
Approach
The objectives of this project were to 1) develop a numerical test procedure for simulation of laboratory scale cyclic DSS tests of granular soil under undrained conditions, 2) validate the numerical model with available laboratory DSS test data and numerical modeling results on uniform diameter glass beads, and 3) develop a procedure to accurately simulate DSS tests of real soil with a particle size distribution representative of natural soil strata. The commercially available distinct element Particle Flow Code (PFC) was used to model constant volume cyclic DSS tests for simulating laboratory scale models in three dimensions. The PFC model used in this project was structured by developing three user-defined routines for representing the major steps in the experimental process: sample preparation, consolidation, and cyclic shear tests. The routines were controlled by a master data file that provided the input needed for each of the routines, which were executed sequentially.
Accomplishments
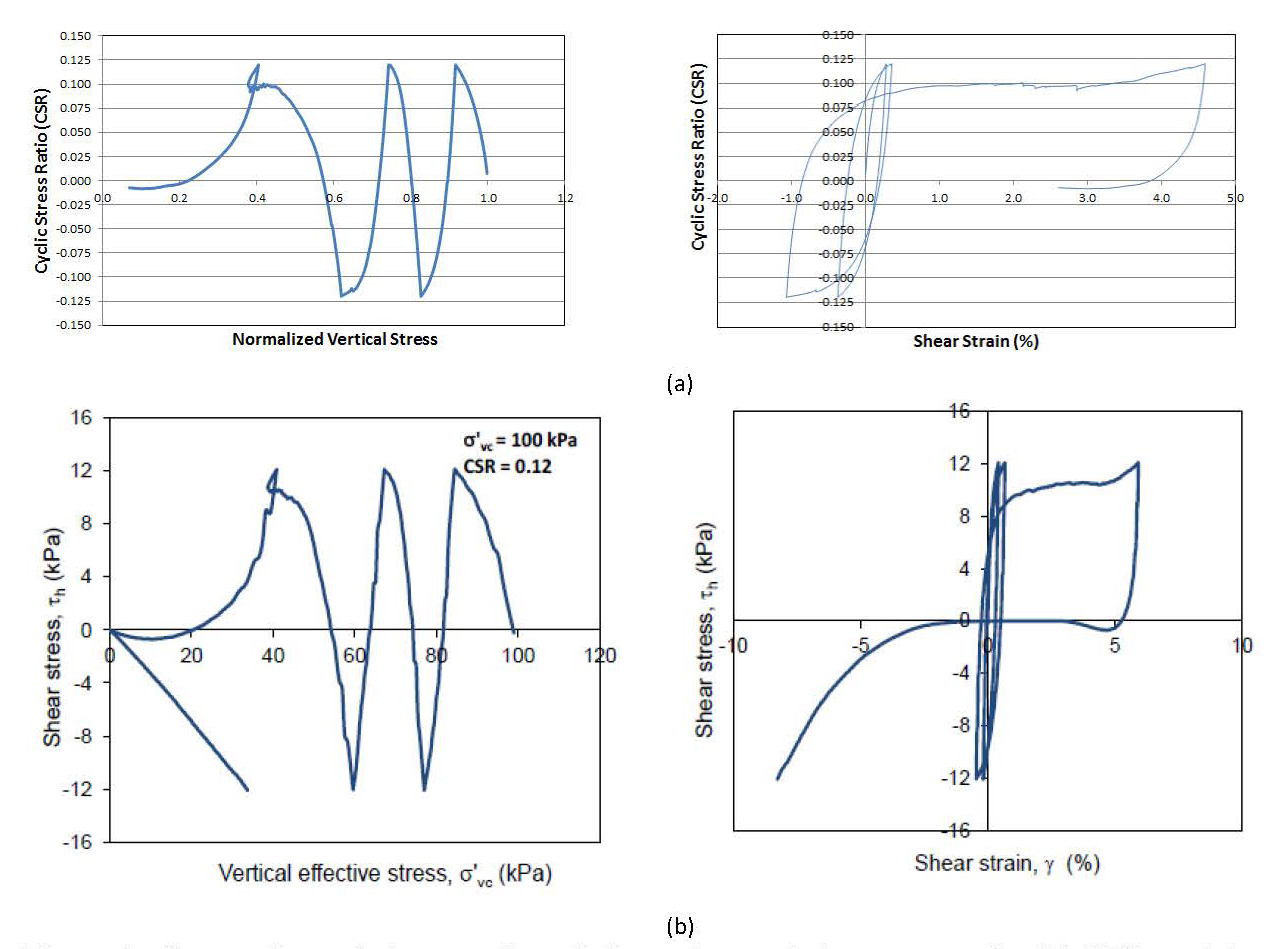
The model was used to simulate laboratory tests of glass beads of uniform diameter. The PFC modeled responses for cyclic shear testing — represented by the standard curves, shear stress vs. vertical stress, shear stress vs. strain, and excess pore pressure generation — replicated similar behaviors observed in laboratory tests and modeling by Dabeet et al. (2014), as shown in Figure 1. The model response with uniform particle size was verified for parametric variations of 1) effective vertical stress representing in situ stress state, 2) the cyclic stress ratio as a measure of shear loading from earthquake, and 3) changing particle to particle friction coefficient representing the liquefaction resistance capacity of soil. PFC was then used to simulate sample preparation of grain scale soil samples comprising non-uniform sand particles with a particle size distribution. We used Fraser River sand to study simulation of the deposition of granular sand. Two approaches for disposition were developed: the pluviation and periodic boundary methods. The modeling approach (sample preparation of realistic soil and cyclic testing) developed in this research provides a framework and capability to conduct further research and study liquefaction potential through a series of tests of different soil deposits that otherwise may not be possible using laboratory DSS tests. The capabilities developed and verifications conducted to date support a larger initiative to develop a consortium to investigate the important process of earthquake-generated liquefaction.

Figure 1: Comparison of stress path and shear stress strain response for (a) PFC model simulation and (b) Dabeet et al.

