
Background
Experimental models of the brain offer the potential to rapidly screen therapies and study the response of brain cells to environmental stresses with great precision. Automated tracking of neurogenesis—the dynamics of how neurons form networks—would be transformative for identifying treatments for more than 1 in 6 Americans suffering from neurological disorders; however, current screening methods are limited in their ability to quantitatively track neuronal dynamics over time and space.
Approach
In this work, we automated the detection of stem cell-derived neurons, including the specific neuron parts, and tracked individual neurons over time during neurogenesis. We used a U-Net algorithm and Peak Local Max function to identify soma and dendrite points for each timestamp of data. The somas were matched from frame to frame by matching somas at the closest pixel location from the previous frame, allowing individual neuron tracking over time.
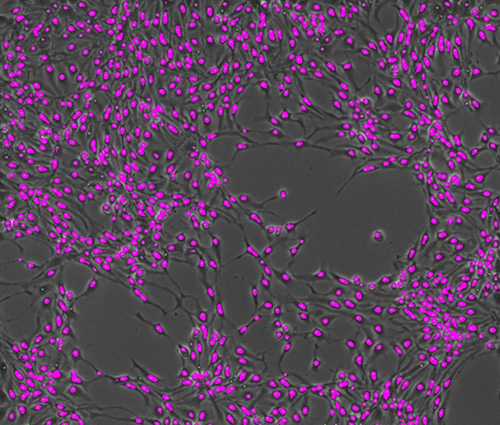
Figure 1: Neurons during neurogenesis with their auto-detected soma shown in pink. The small green dots represent the predicted center points of the somas, which were used for tracking the neurons over time.

Figure 2: Soma (green) and dendrite ends (blue) identified via a U-Net algorithm on a second set of human stem cell-derived set of neurons.
Accomplishments
The U-Net and Peak Local Max function achieved 93.8% precision and 99.1% recall for neuron detection. The probability for a single neuron to be correctly tracked over consecutive timeframes was 85.7%.
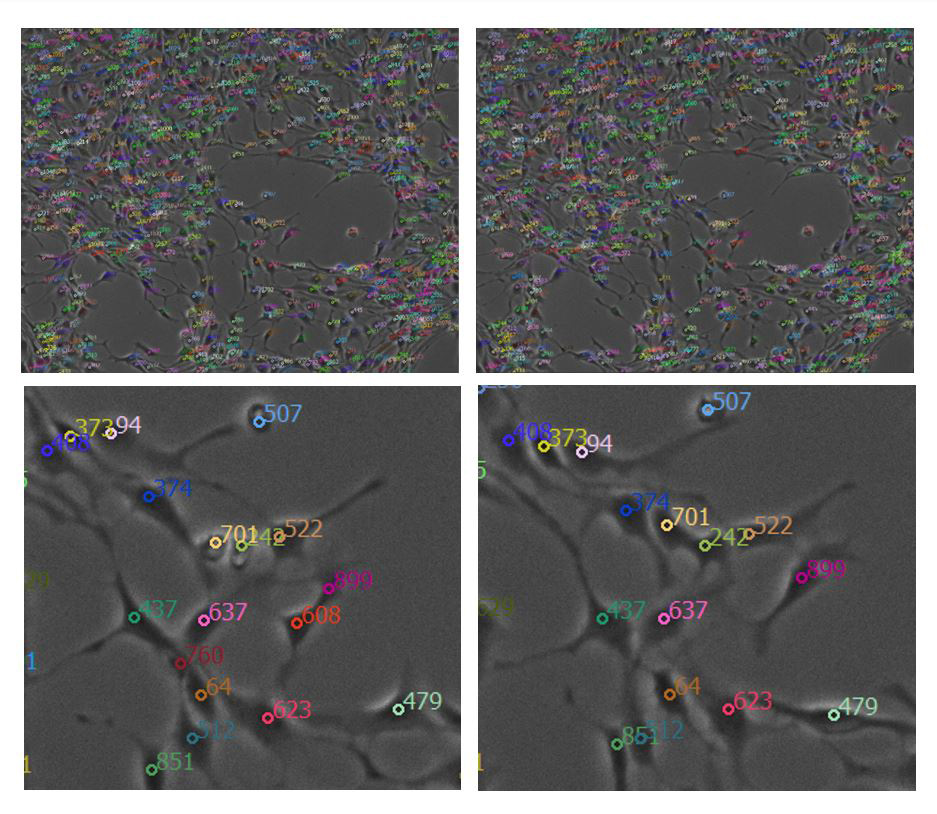
Figure 3: Detected soma automatically tracked from timestamp 1 (top left) to timestamp 2 (top right). A zoomed-in example from the same timestamps are shown in the bottom left and right images, respectively. Each soma is numbered and colored to visually assess how well the algorithm tracked individual neurons over time.