
Background
Fatigue, or damage due to cyclic loading, has overwhelming importance in the assessment of the safety and integrity of structures. Damage Tolerance Analysis (DTA) is an approach to conservatively estimate fatigue life that is used in monitoring and forecasting the integrity of most commercial and defense aircraft structures as they age to ensure safety. DTAs rely on empirically obtained fractographic crack growth data to validate the analytical methods used in the analysis. These data are acquired through high magnification imaging of a crack face using a scanning electron microscope (SEM) and subsequent measurement of the spacing of individual fatigue striations (distinctive step features), which have been shown to have a 1:1 correlation to stress cycles.
The current measurement method is multistep, highly labor intensive, and prone to errors in quantitative measurement. SwRI developed a software tool to partially automate the fatigue striation measurement and counting procedure, increase process accuracy and significantly decrease the time required for image analysis and feature measurements. Implementation of this software tool increases the cost efficiency and consistency of the data acquisition and the robustness of the overall DTA.
Approach
A tool was coded in Python programming language to allow the user to rapidly assess and measure fatigue striations on SEM images using extracted grayscale intensity profiles. Outputs generated from the program include an image documenting the location of the measurements, plots to aid the user in verifying the consistency of the measurements, and tabular form measurement data. A benchmarking study indicated that of the several different image analysis methods investigated, a specific peak-finding algorithm paired with a median filtering function produced spacing measurements that were within one striation of manual count results for more that than 85% of cases.
Accomplishments
The tool was successfully validated on a crack face generated by a known fatigue loading spectrum history. Striation generated crack growth data was shown to be within 20% of the test data, sufficient for implementation in inspection cycle management applications. Processing of the images using the tool was shown to have an efficiency increase of nearly 20× over the traditional workflow method. This increased efficiency makes the tool-based analysis method cost-effective for use in supporting enhanced DTAs.
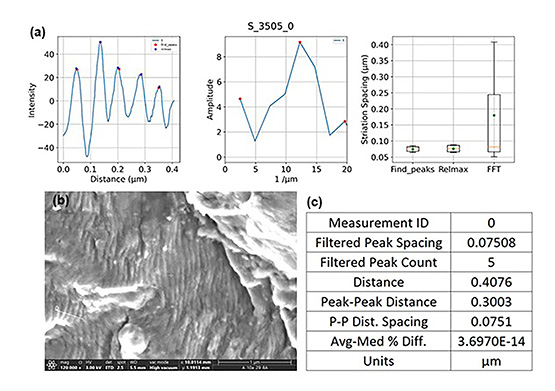
Figure 1: Outputs of the program, per image: (a) figure of plots, (b) annotated image, and (c) a table of example outputs documented in an Excel spreadsheet.
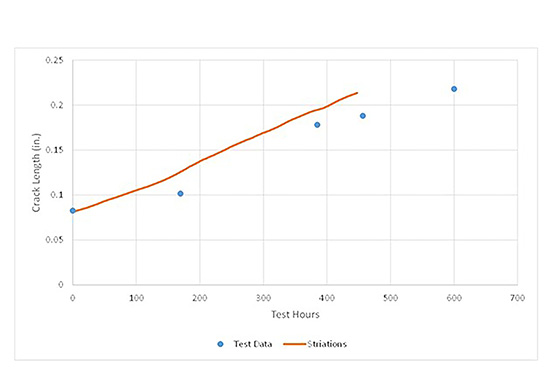
Figure 2: Plot of crack growth curve calculated from striation spacing (orange line) versus actual test data (blue points).