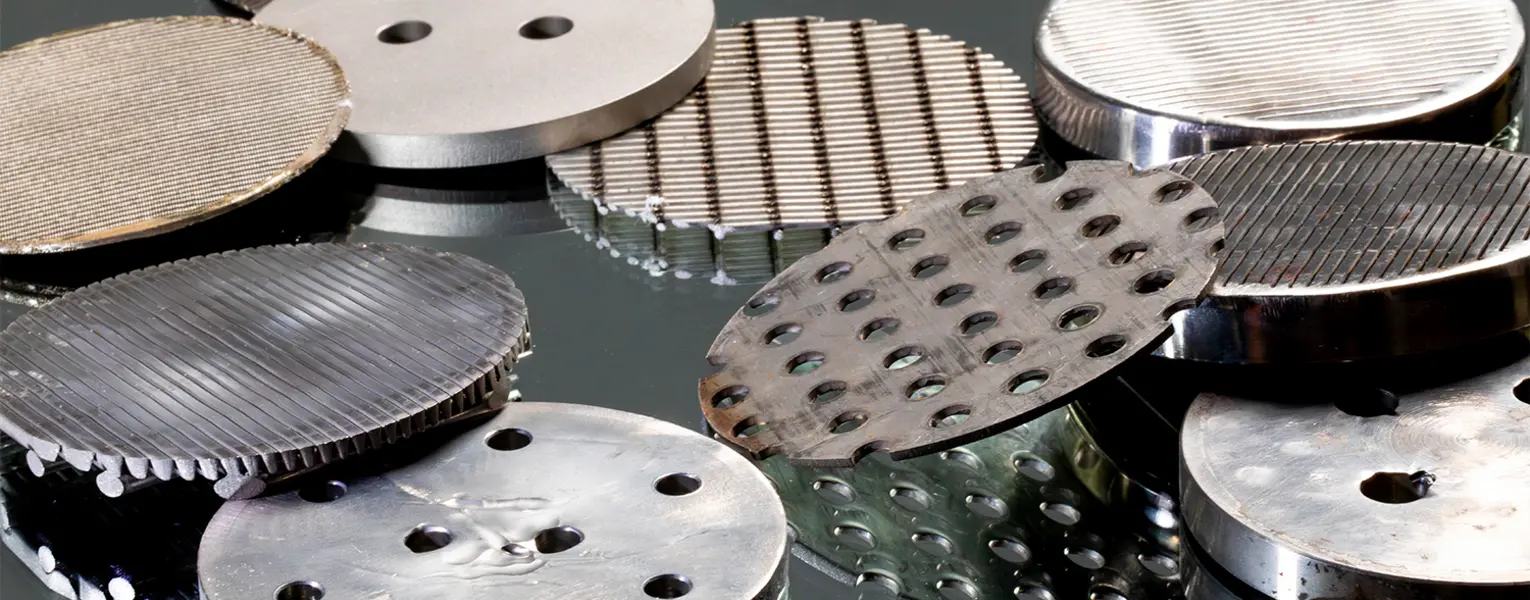
Southwest Research Institute has a well-established sand control screen erosion program that originated in the late 1990s. The oil and gas industry uses sand control screens to minimize the sand produced by a well, but screens can erode and fail as particles finer than screen filtration size flow through screen gaps. These fine particles can eventually cause sand control screen failures that allow substantial amounts of large particle sand to be produced to the surface. This erosive flow jeopardizes the functionality of well equipment. Experimental testing can help our customers understand the relative performance of different types of sand control screens, and how those screens will perform over the life of a well.
Sand Control Screen Coupon Evaluation
Three recirculating slurry test rigs are available for testing three-inch coupon samples of sand control screens. The tests rigs provide a wide range of erosive flow approach velocities (0.7ft/s – 3.5ft/s). Tests typically last 18 to 72 hours and have a particle concentration of 10,000 ppmw or less. All three test rigs were engineered to be able to transport particles in water without the use of a viscosifying agent; however, viscosity-altering agents such as glycols and polymers can be used to simulate field conditions.
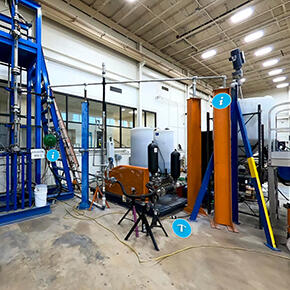
Erosion Flow Test Facilities
SwRI has three erosive flow facilities dedicated to liquid particle flow testing. The facilities can perform flow testing on full-scale test articles or materials to mimic a wide variety of field conditions. The three facilities are designed to perform testing with sand and water, but can operate with fluids such as particle-laden oils, drilling muds, and polymers.
Evaluation Methods
Erosion of sand control screen coupons can be evaluated with microscopy and other methods, including:
- Maximum Particle Passed Testing (MPP)
- ISO 17824 Annex C – Sized-bead test method
- API 19SS Annex D – Determination of maximum particle size that passes through a metal-mesh sand control screen
- Filter Cut Point Testing (FCP)
- Erosion Rate by Mass
- Erosion rate is determined as a ratio between mass loss of the sand control screen coupon sample and the total particles that passed through the sample.
Microscopy Solutions
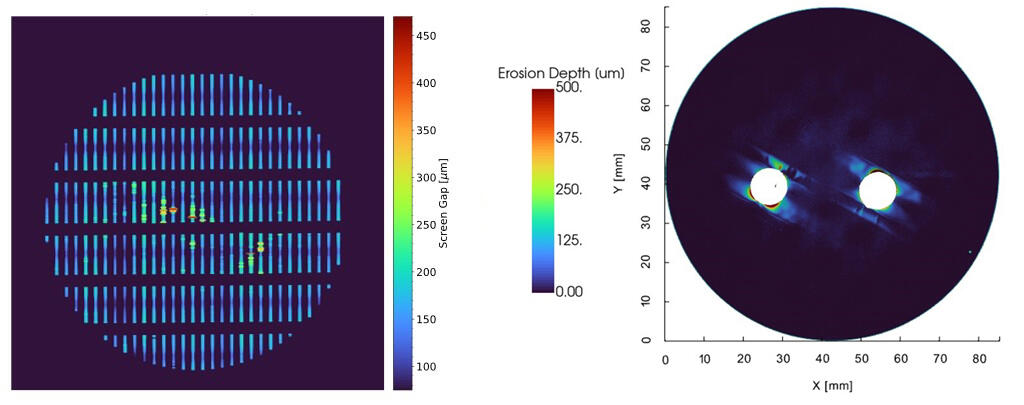
The pictures below were generated to gain an improved understanding of the relationship between different erosion characterization methods, including the filter cut point testing method, the maximum particle passed testing method, and our novel microscopy approach. In our novel coupon analysis (left), a wire-wrapped sand control screen coupon is photographed using microscopy. The image is then post-processed to determine the largest screen gap. This method can also be used to create a heat map of the gaps. The heat map can be useful in the identification of erosion hot spots on a screen and understanding the overall spatial distribution of the erosion.
SwRI also uses a 3-D surface scanner with submicron resolution to characterize the erosion of base pipe coupons (right). This inspection method helps in determining the patterns of the flow and provides a better understanding of the overall flow interactions between the screen components.
Erosion evaluation on different coupon pieces can be performed: Backlit microscopy is used to analyze changes in wire-wrapped sand control screen gaps (left), and 3-D surface scanning is used to evaluate wear in base pipes (right).
Full-size Sand Control Screen Assembly Testing
SwRI can test full-size sand control screen or ICD assemblies up to five feet long and up to seven inches in diameter using our erosion fixtures that simulate annular to wellbore flow. Erosion of the tool can be quantified using flow performance testing or advanced imaging techniques, depending on the project’s goals. Visit our ICD page for more information on flow performance testing.
Experimental Testing
SwRI also provides unique expertise and capabilities for conducting customized sand control screen testing. Customized flow loops or facility modifications can be designed and implemented to meet the goals of your project.
Visit Slurry Flow Testing or Erosion Testing and Modeling for additional capabilities.
Computational Fluid Dynamics (CFD) Erosion Modeling
SwRI has validated the SwRI proprietary erosion CFD model against erosion testing on sand control components (screen and base pipe). The SwRI CFD erosion model was found to be able to predict erosion with good accuracy on complex geometries (such as a sand control screen). This correlation means that experimental erosion testing can be paired with computational fluid dynamics (CFD) modeling to model field conditions that are not easy to replicate in a lab. A small-scale test can be used to validate the geometry of a CFD model, and then a more aggressive or large-scale condition can be analyzed using SwRI’s CFD erosion model.
The SwRI erosion model has been experimentally validated to be more accurate than other commercially available models. For more information on CFD analysis, visit Fluids Engineering CFD.
For more information about erosion testing, please contact Jessica Brysch, at +1 210 522 2807.
Microscopy Tool for Screen Erosion Evaluation
New method helps visualize sand control screen erosion with velocity contour through the screen and base pipe coupon layers.


